New exclusive property market research by SellingUp.com has revealed which postcodes in England and Wales are most heavily for sale and which are the least on the move.
The research – which benchmarks the UK property market in the month of the EU Referendum – takes the number of households in each postcode district and compares it against how many residential properties were listed for sale on leading property portals.
The detailed research covers 2269 postcode districts from AL1 (St Albans, Hertfordshire) through to YO8 (Selby, North Yorkshire) as listed in the 2011 census. But because 2269 is rather of lot of postcodes to show in one table on this page, we have grouped the districts into their postcode areas (the letter part before the numbers) of which there are 103. The main property portal referenced was Rightmove.co.uk – see below for details on the research method.
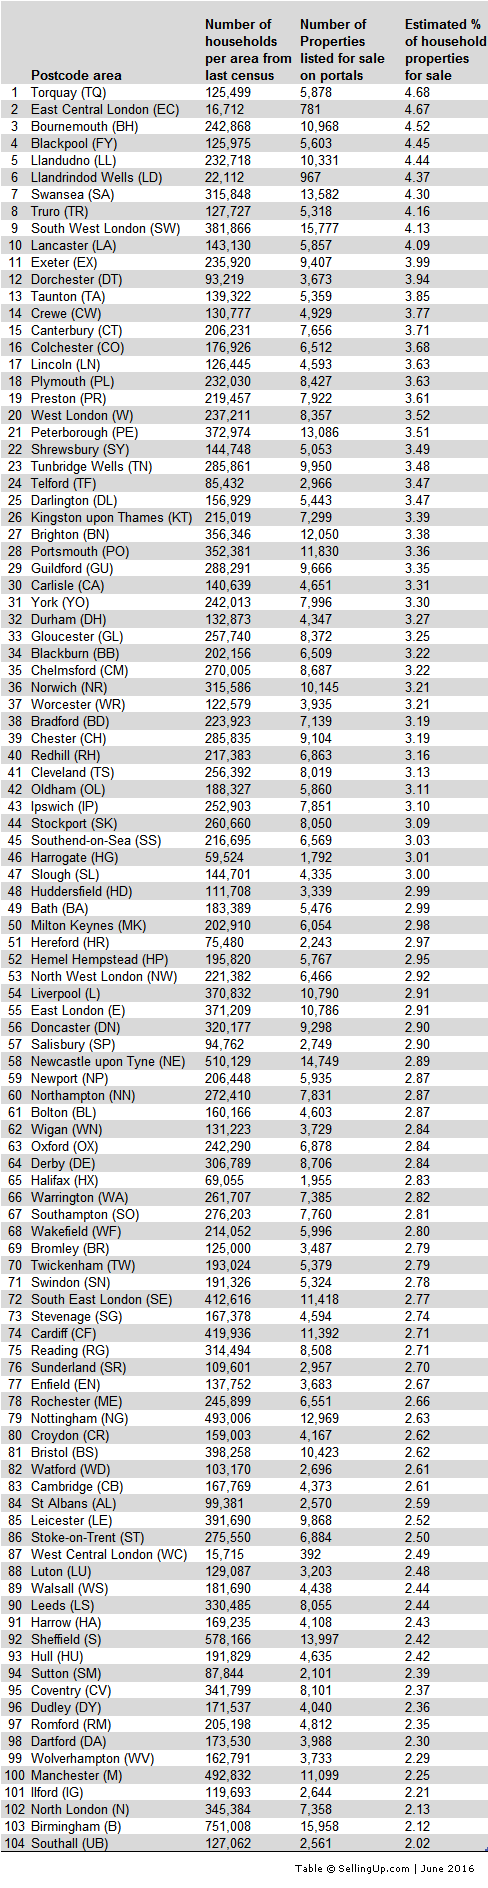
Table of ‘For Sale’ Postcode Areas – June 2016
Please note: this table was compiled by SellingUp.com – please contact us if you would like to feature it on your website or you are welcome to link to this page
If you have a local website and would like the full postcode district data for any area to share with your readers just contact us and we will pass it on. You’ll be able to see in which parts of your local area owners are on the move and in which they are settled down in (or stuck because they can’t get a new mortgage).
Analysis & Comments
“No, we don’t want to live beside the seaside!”
As the table reveals, the postcode area that is the most selling up turns out to be Torquay on the South Devon ‘English Riviera’. In fact, the top 10 in this selling up list is dominated by holiday/retirement areas – Bournemouth (South coast), Blackpool (North West coast), Llandudno (Welsh coastal resort), Llandrindod Wells (spa resort destination) and Truro (covering West Cornwall including Newquay, St. Ives and Penzance).

- Coastal Torquay in South Devon is the number one area for selling up (original wiki pic via by ianmacm)
SellingUp.com asked a few local estate agents in these holiday hotspots for their view on why these resorts have more than average for sale and we were given a range of theories from the proliferation of second homes to goverment tax policy to the EU referendum.
One agent, Bournemouth estate agent Alan Mather of BH Sales and Lettings held the view that the nature of properties in coastal resorts could be a factor in why so many are for sale.
“People want to live in Bournemouth but the place is saturated by flats,” he said. “They want houses but everything with character has been carved up. The flats aren’t selling as they are overpriced – inflated by other estate agents – and now people have to consider the government price increases that go with owning a second home.”
Southall – standing still on the property ladder?
The least selling up area is West London’s Southall, best known as “Little India” due to its huge majority Asian population.

Owners in Southall, in West London, seem happy to stay put on the property ladder
A ring around some local Southall estate agents revealed that the reason for the relative lack of property for sale could be to do with cultural factors.
Sakib Afzal, manager of Right Time Estates told us: “They love it here becuase there is a massive Asian community and Asian shops and restaurants and everything they require. The community don’t want to leave. It’s very family orientated and a mixed culture. Families sometimes pass them onto each other and they don’t advertise. Flats are a good investment and landlords are holding onto them. Also, it’s close to Heathrow for people getting back home, and not too bad to get to central London.”
Gulbir Dhillon, manager of Smile Estate Agents agreed: “A lot of people don’t want to sell their properties, they just don’t want to leave. In some cases it can be they are sold within the family and never reach the sales market.”
North London could be heading south for agents
In the London property boom of the last 20 years North London is one of the areas often cited as where prices have gone through the roof, but it looks now as if the market has settled down.
The N postcode area which covers some expensive districts including Islington, Hackney, Highgate and Muswell Hill is langushing third from bottom of the table, suggesting that far fewer than average homeowners want to – or can afford to – sell up.
The lack of stock for sale could be bad news for buyers who are faced with scant choice, and bad news for estate agents who will be bemoaning the lack of stock – which means a lack of sales commission. It might be good news for sellers however who will face less competition from other properties for sale – unless of course they are also trying to buy within the same postcode.
North London mortgage broker Andrew Nicolaides, Director of Elite Mortgage Finance, told SellingUp.com: “A lot of my clients are re-mortgaging and choosing to refurbish and extend their properties to make more living space so they don’t need to move. When property prices are as high as they are in North London it’s often more cost effective and easier for homeowner occupiers to get the finance to extend compared to selling up.”
Notes about the Research
This research was commenced in the first week of June and first published in late June 2016.
The households data source was the 2011 census of England and Wales.
The majority of the ‘properties for sale’ data is from the pages of Rightmove.co.uk, which claims to contain 90% of property listings in the UK. The only area where Rightmove was not used as a data source was Swansea (SA) because it represents an “anomaly” (source: Rightmove press office) in being the only area where Rightmove is not the dominant listings portal. In this case the source of property listings was Zoopla.co.uk
The issue of duplication in property listings caused by multiple listings of the same property by different estate agents was not factored in for two reasons: 1. a manual sample pages count estimated the percentage of duplications to be around 10% and therefore this would approximatley equate to the 10% of unfeatured properties not on Rightmove and therefore the headline figures would not be grossly distorted, 2. the table is ranked by percentages and therefore it is assumed that multiple listings will be at a similar level across all areas, so would not markedly affect the ranking order.
If you have a local website and would like the full postcode district data for any area to share with your readers just contact us and we will pass it on. You’ll be able to see in which parts of your local area owners are on the move and which they are settled down in (or stuck because they can’t get a new mortgage).